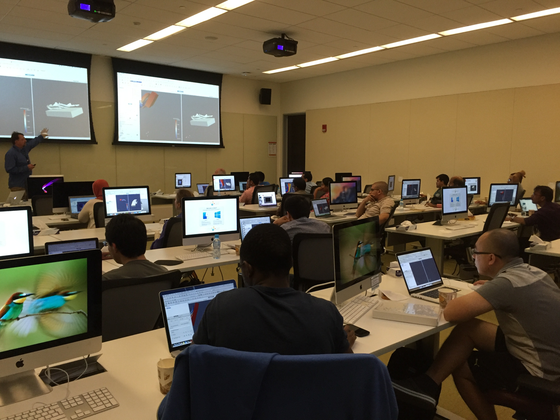

Introduction to Scientific Visualization with ParaView
Thursday, February 9
8:30 a.m. — 12:00 p.m.
Computer Lab Room, Level 3, University Library
The Visualization Core Lab is pleased to announce a half-day workshop to introduce scientific visualization and analysis using ParaView. ParaView is an open-source, multi-platform data analysis and visualization application that makes it easy to build insightful visualizations, perform complex qualitative and quantitative data analysis, and explore data interactively in 3-D. The data exploration can be done via the ParaView GUI, or programmatically using ParaView’s Python API. Attendees will participate in a hands-on session working with ParaView to create 3-D visualizations of scientific datasets.
ParaView is developed and maintained by Kitware, Inc. to analyze extremely large datasets using distributed memory computing resources. It can be run on supercomputers to analyze datasets of terascale as well as on laptops for smaller data. Here at KAUST, it is available on all High-Performance Computing systems, as well as on individual scientific workstations.
Registration and agenda
Please register here. The number of seats is limited to 33, so please register early to ensure a seat at the workshop. Additional details and an up-to-date agenda will be available here.
Thank you,
The Visualization Core Lab

